

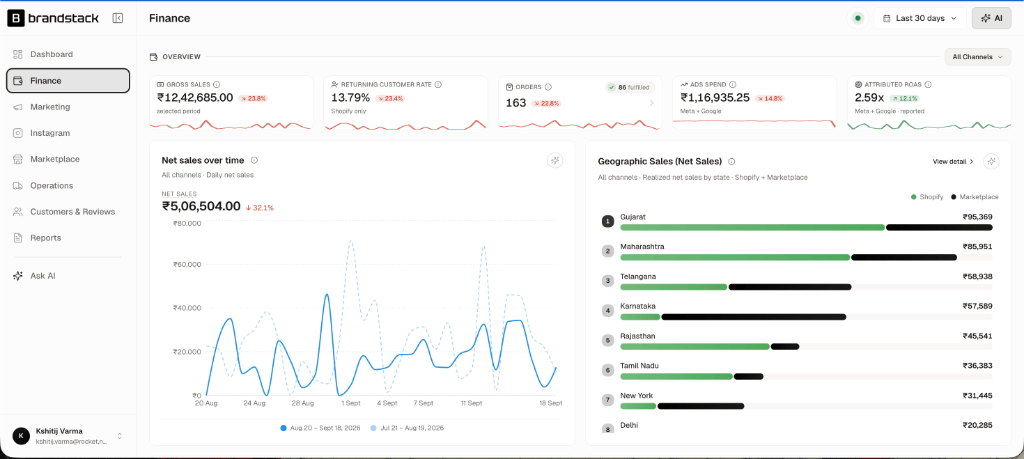
Brandstack Finance Overview: Top financial KPIs, Net Sales trend, and Geographic channel distribution
The Accounting Reality: Traditional accounting software tells you what happened last month. Brandstack Finance tells you what is happening today—reconciling returns, ad burn, and channel commissions into clean, realized numbers before month-end surprises hit your bank balance.
1. Top Financial KPI Strip
The top strip aggregates the 5 core levers governing your brand’s financial health:Gross Sales
Total booked value across all channels before discounts, cancellations, or returns.Current Period:
₹12,42,685.00 (↘ 23.8%)Returning Customer Rate
Percentage of orders from repeat buyers (tracked for Shopify D2C).Current Period:
13.79% (↘ 23.4%)Why it matters: Returning customers carry zero direct ad acquisition cost. When this drops, blended CAC rises and squeezes operating margins.Total Orders & Fulfilled
Volume of booked orders alongside completed warehouse dispatches.Current Period:
163 Orders (86 Fulfilled)Blended Ads Spend
Combined advertising spend across Meta Ads + Google Ads.Current Period:
₹1,16,935.25 (↘ 14.8%)Why it matters: Tracks daily marketing burn in one unified currency figure.Attributed ROAS
Blended ad return on investment reported across Meta and Google.Current Period:
2.59x (↗ 12.1% in green)Strategic Insight: Notice that while total ad spend dropped 14.8%, ROAS improved by 12.1%—showing tighter, more efficient ad spend even as top-line volume softened.2. Realized Net Sales Over Time
The Net sales over time card plots your daily realized net revenue against the prior period:- Headline Metric:
₹5,06,504.00(↓ 32.1%) - Solid Blue Curve: Current selected period (e.g.,
Aug 20 – Sept 18, 2026). - Dotted Light-Blue Curve: Previous comparative period (
Jul 21 – Aug 19, 2026).
Why Period-over-Period Overlay Matters:
- Separates Seasonality from Strategy: E-commerce sales naturally fluctuate based on paydays (1st–5th of the month) and weekends. By comparing the solid line against the dotted line, you can immediately tell whether a dip is a standard mid-month lull or an abnormal drop in demand.
- Measures Campaign Durability: When running sales events or launching new collections, the curve reveals whether revenue stayed elevated or crashed immediately back down after the first 24 hours.
3. Geographic Sales: Realized Net Sales by State
The Geographic Sales chart reveals where your cash actually comes from—and critically, which channel captures the demand in each state:Geographic Sales breakdown comparing D2C Shopify vs. Marketplace sales per state
- ● Green: Shopify (Direct D2C)
- ● Black: Marketplaces (Amazon, Myntra, Flipkart, Eternz)
Strategic Takeaways from State Channel Splits:
4. Average Order Value (AOV) & Basket Economics
Below the revenue charts, the Average order value over time visualizer monitors basket size velocity: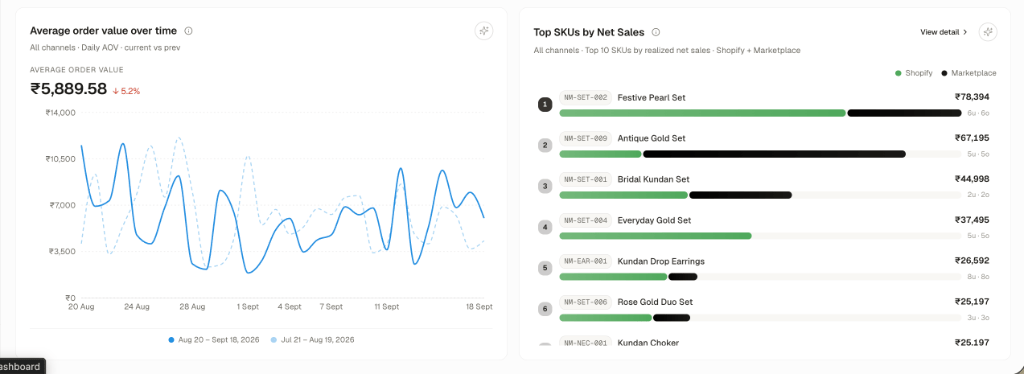
Average Order Value (AOV) daily fluctuations and top SKU revenue leaderboard
- Headline AOV:
₹5,889.58(↓ 5.2%vs previous period) - Visual: Solid blue line (current 30 days) vs. dotted light-blue line (prior 30 days).
Why AOV is Your #1 Profit Multiplier:
In D2C, fulfillment and courier expenses are largely fixed costs per parcel (typically ₹80 to ₹140 per package in India, regardless of whether the customer spent ₹1,500 or ₹6,000).- High AOV (₹5,800+): Fixed logistics fees take up only ~2% of the order value, leaving plenty of margin to cover paid ad CAC.
- Low AOV (<₹2,000): Fixed logistics and RTO risk consume 10%–15% of revenue, severely squeezing contribution margins.
- Founder Action: When AOV trends downward, introduce tiered combo discounts, bundle upsells at checkout, or free gift thresholds (e.g. “Free jewelry pouch on orders above ₹6,500”).
5. Top SKUs by Realized Net Sales
The Top SKUs by Net Sales leaderboard identifies the product lines generating the bulk of your realized cash, broken down by Shopify (Green) vs. Marketplace (Black):Strategic Inventory & Pricing Decisions from SKU Data:
- Protect D2C Exclusives: SKUs like
NM-SET-004(Everyday Gold Set) sell 100% on Shopify. Do not list them on marketplaces where commissions (15%–25%) would unnecessarily cut into your margin. - Prioritize Marketplace FBA / Hub Stock: SKUs like
NM-SET-009(Antique Gold Set) drive 80% of sales on marketplaces. Ensure sufficient stock is allocated to Amazon and Myntra fulfillment centers to prevent “Out of Stock” ranking penalties. - Hero Ad Creative Selection: Align your Meta ad budget with SKUs that show high direct D2C conversion (like
NM-SET-002andNM-EAR-001) rather than advertising products that buyers end up purchasing on Amazon.
6. Financial Operating Cadence for Founders
To keep cash flow healthy and margins protected, follow this weekly financial review:1
Check Returning Customer Rate
If the repeat customer rate drops below 15%, evaluate your post-purchase email and WhatsApp retention flows. Relying 100% on new customer acquisition drives up CAC.
2
Audit High-Marketplace States
Look at states like Karnataka or Delhi where marketplace sales heavily outpace Shopify. Test targeted D2C promotions or faster shipping options to capture more high-margin direct orders.
3
Track Daily AOV Trend
If daily AOV drops significantly below your 30-day baseline (₹5,889), review whether a recent discount campaign encouraged lower-ticket single purchases instead of combo sets.
4
Inspect SKU Channel Contribution
Check whether your highest-revenue SKUs are selling primarily on D2C or marketplaces. Adjust warehouse stock transfers accordingly to avoid stockouts on high-velocity marketplace listings.