

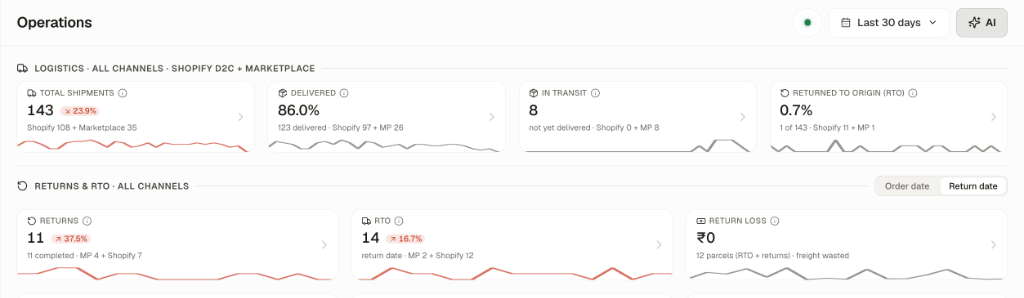
Brandstack Operations: Total shipment status strip, delivery rates, and returns & RTO breakdown
The Logistics Cost of RTO: In India, an RTO parcel incurs forward shipping + reverse shipping + courier handling charges (typically ₹140 to ₹220 per failed delivery), plus tied-up inventory. Cutting RTO by just 3% directly injects thousands of rupees into your net profit.
1. Executive Logistics & Returns KPI Strips
At the top of the Operations dashboard, performance is categorized into two distinct operational strips:A. Logistics Overview (All Channels · Shopify D2C + Marketplaces)
Monitors the forward dispatch pipeline across all 143 shipments:Total Shipments
143 Total Dispatches (
↘ 23.9%)Channel Split: Shopify D2C: 108 | Marketplaces: 35Delivered Rate
86.0% Overall Delivery RateBreakdown: 123 successfully delivered (Shopify 97 + Marketplaces 26).
In Transit
8 Parcels In TransitReal-Time Pipeline: 0 Shopify + 8 Marketplace shipments currently out for delivery.
Macro RTO Rate
0.7% Overall RTOCohort: Only 1 parcel permanently failed delivery in this window.
B. Returns & RTO Strip (All Channels)
Tracks customer returns and reverse logistics friction:- Returns Completed:
11(↗ 37.5%— MP 4 + Shopify 7). Measures parcels returned by customers post-delivery. - RTO (Returned to Origin):
14(↗ 16.7%— MP 2 + Shopify 12). Failed deliveries returned before handover. - Return Loss:
₹0(12 parcels freight wasted). Tracks unrecoverable shipping charges burned on reverse logistics.
Accounting Basis Toggle (
Order date vs. Return date): Toggle between Order date (cohort tracking to see which marketing campaigns drove returns) and Return date (warehouse receiving date to monitor physical inventory check-ins).2. Root-Cause Return Analysis & Channel Disparity
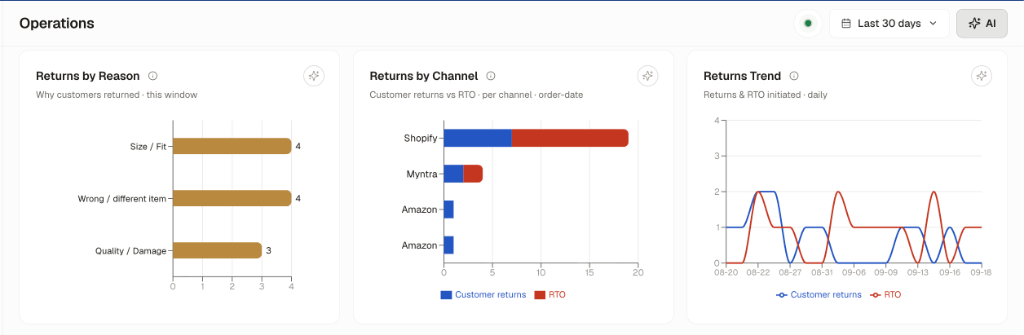
Returns by reason, customer returns vs. RTO per channel, and daily return initiation trends
A. Returns by Reason: The Preventable Friction Audit
Why do customers send items back? Brandstack categorizes return notes into 3 core buckets:- Size / Fit (4 returns): The customer received the item, but rings were too tight or necklaces fell at the wrong length.
- Solution: Add printable ring sizers, model collarbone reference images, and exact chain length measurements on Shopify product pages.
- Wrong / Different Item (4 returns): 🚨 Warehouse Packing Error!
- Critical Diagnostic: 4 customers received the wrong SKU because warehouse pickers mixed up similar-looking pieces. Implementing barcode scan-and-pack in Unicommerce or Shiprocket completely eliminates this 100% preventable cost.
- Quality / Damage (3 returns): Transit damage or delicate clasp issues.
- Solution: Upgrade jewelry boxes to reinforced foam inserts to prevent shipping transit fractures.
B. Returns by Channel: Customer Returns vs. RTO
Contrasts post-delivery Customer Returns (Blue) against doorstep RTOs (Red) across platforms:- Shopify D2C: Accounts for 7 Customer Returns and 12 RTOs (Total ~19).
- Myntra: 2 Customer Returns and 2 RTOs.
- Amazon: 1 Customer Return and 0 RTOs.
C. Daily Returns & RTO Trend
The line chart tracks the daily tempo of customer returns (blue) vs. RTO initiations (red). Peaks (such as August 22, September 4, and September 14) alert operations leads to investigate whether a specific courier partner encountered regional transit delays.3. D2C Courier Intelligence & The State RTO Matrix
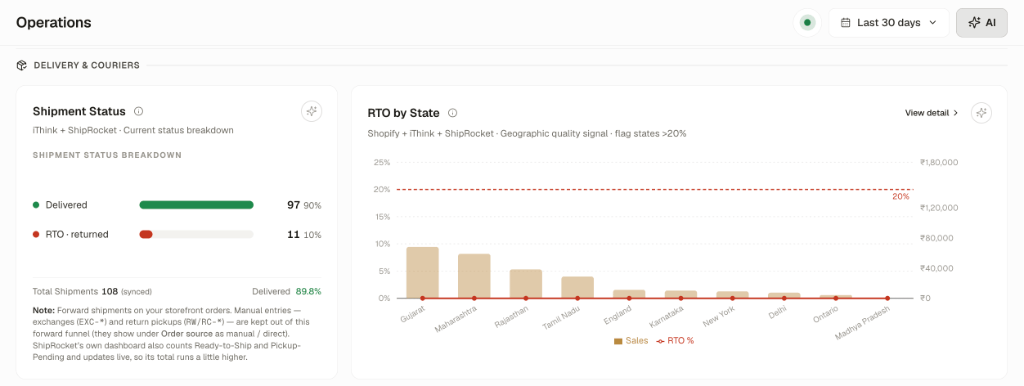
Shipment status via iThink and Shiprocket, and the State RTO Matrix with 20% danger threshold
A. Shopify Forward Shipment Status (iThink + Shiprocket)
Tracks real-time parcel lifecycles across connected courier aggregators:- Delivered: 97 shipments (90%) successfully completed.
- RTO Returned: 11 shipments (10%) failed and routed back to origin.
- Total Synced Forward Shipments: 108 orders (Delivered rate: 89.8%).
EXC-* and reverse pickups RW/RC-* are cleanly filtered out to keep forward delivery funnels accurate).
B. RTO by State (The 20% Danger Line)
This chart plots State Sales (brown vertical bars) against RTO % (red curve), overlaid with a prominent 20% red dashed threshold line:- Gujarat, Maharashtra, Rajasthan, Tamil Nadu: Command high sales volumes with RTO rates sitting safely near 0%–5%.
- The 20% Threshold Rule: When a state’s RTO curve touches or exceeds the red 20% dashed line, it triggers an immediate operational flag.
4. Marketplace Delivery & Courier SLAs (Unicommerce Sync)
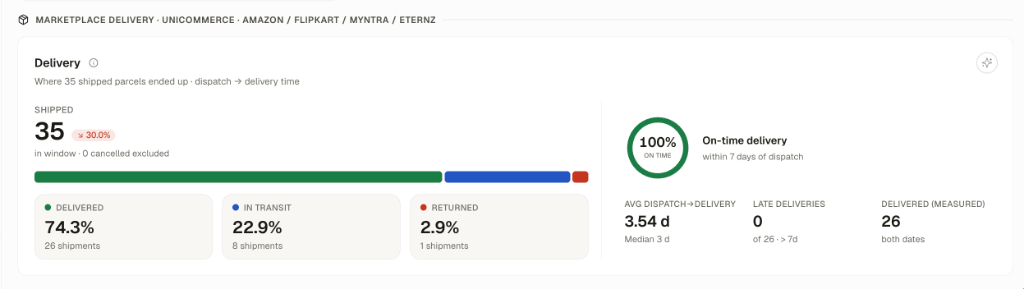
Marketplace fulfillment funnel via Unicommerce: on-time delivery rate, transit velocity, and late shipments
A. Marketplace Fulfillment Funnel (35 Shipped Parcels)
- Delivered: 74.3% (26 shipments completed).
- In Transit: 22.9% (8 shipments currently in transit).
- Returned: 2.9% (Only 1 shipment returned).
B. Courier SLA & Transit Speed
Marketplace algorithms heavily punish sellers with slow fulfillment. Brandstack monitors your exact delivery SLAs:5. The Operations Lead’s Daily Protocol
Follow this 4-step checklist every morning to maintain fulfillment velocity and eliminate avoidable reverse shipping fees:1
1. Check In-Transit Stalls
Inspect the In Transit counter (8 shipments). If any parcel has been stuck in transit for more than 4 days without a courier scan, initiate an NDR (Non-Delivery Report) ticket with Shiprocket or iThink.
2
2. Audit Warehouse Packing Accuracy
Review Returns by Reason. If “Wrong / different item” appears, inspect the warehouse packing station to ensure pickers are verifying SKU codes on packaging barcodes before sealing flyers.
3
3. Enforce State RTO Limits
Check the RTO by State chart against the 20% threshold. If a state experiences repeated non-deliveries, update your Shopify shipping rules to restrict COD in those postal zones.
4
4. Verify Marketplace On-Time Delivery
Ensure your On-Time Delivery Rate stays at 100% and transit times average under 4 days to preserve seller ratings on Amazon and Myntra.