

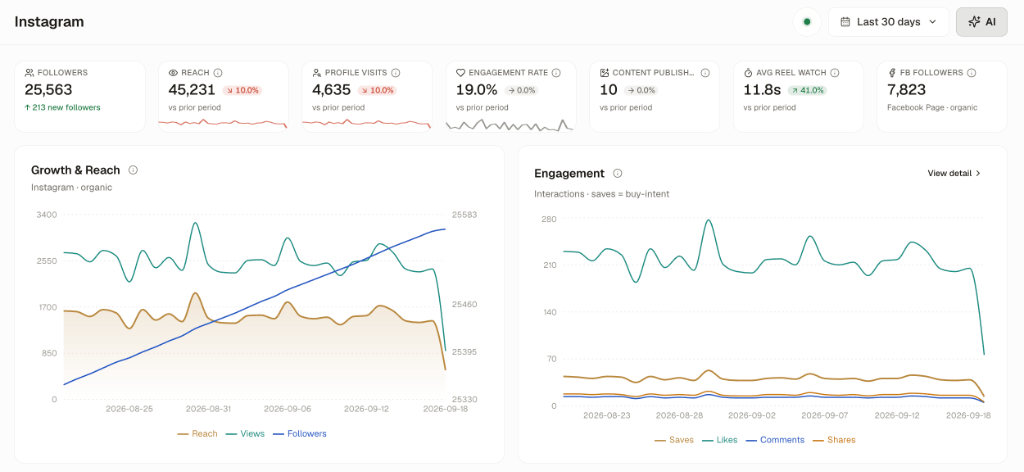
Brandstack Instagram: Core KPI strip, 30-day organic growth & reach curve, and multi-line engagement breakdown
The Organic Halo Effect: Paid ads rent an audience; organic Instagram builds an asset. Tracking Saves and Average Reel Watch Time gives growth teams advance warning on which styles and designs will sell out before running paid ads.
1. Top Instagram KPI Strip
The top executive strip monitors audience accumulation and audience attention:Followers & Growth
Total follower count:
25,563Net Growth: ↑ 213 new followers over the selected 30 days.Organic Reach
Unique accounts that viewed your posts, stories, or reels.Current Period:
45,231 (↘ 10.0% vs prior period)Profile Visits
Users who clicked through to your profile after seeing content.Current Period:
4,635 (↘ 10.0%)Why it matters: Profile visits represent high purchase intent—this is where users click your link-in-bio to visit your Shopify store.Engagement Rate
Total interactions divided by total reach:
19.0% (→ 0.0%).Benchmark: Typical e-commerce Instagram accounts average 1.5%–3.0%. A 19.0% engagement rate indicates an exceptionally active, loyal customer base.Content Published
Total output in the 30-day window:
10 items (→ 0.0%).Cadence: Measures creative publishing velocity across feed posts and reels.Avg Reel Watch Time & FB
- Average Reel Watch:
11.8s(↗ 41.0%improvement). - Facebook Page Followers:
7,823organic followers.
2. Organic Growth & The “Saves = Buy-Intent” Framework
The top dual charts plot audience expansion against real customer engagement:A. Growth & Reach (Instagram · Organic)
- Dual Y-Axis Visualizer: Plots daily Reach (gold filled area) and Views/Impressions (green curve) on the left axis against cumulative Followers (blue upward curve) on the right axis.
- Trajectory: Follower count demonstrates a smooth, sustained climb from 25,350 to 25,563.
- Diagnostic Value: Spikes in reach (e.g. August 29 and September 14) correspond to viral reel distribution that pulls in fresh non-follower discovery.
B. Engagement Breakdown: Why “Saves = Buy-Intent”
The Engagement chart tracks 4 distinct interaction types:3. Content Performance Grid: Post & Reel Leaderboard
The Content Performance module ranks individual posts and reels by total organic reach, displaying key engagement metrics directly on the creative card: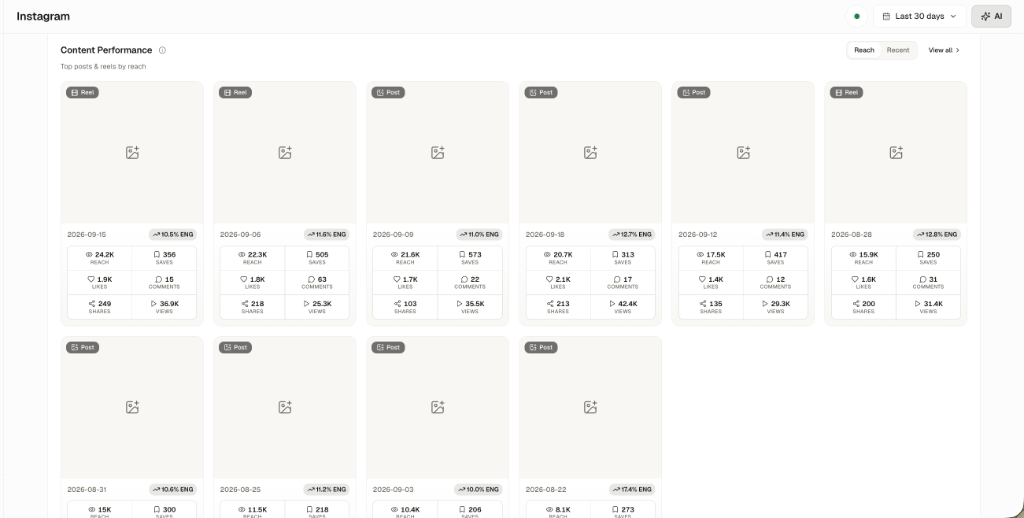
Content Performance grid: Top posts and reels ranked by reach with engagement rates and saves
Top Performer Breakdown:
- Reel (Sept 15):
10.5% ENG· 24.2K Reach · 356 Saves · 1.9K Likes · 15 Comments · 249 Shares · 36.9K Views - Reel (Sept 06):
11.6% ENG· 22.3K Reach · 505 Saves · 1.8K Likes · 63 Comments · 218 Shares · 25.3K Views - Static Post (Sept 09):
11.0% ENG· 21.6K Reach · 573 Saves (#1 Highest Saves!) · 1.7K Likes · 35.5K Views - Post (Sept 18):
12.7% ENG· 20.7K Reach · 313 Saves · 2.1K Likes · 42.4K Views (#1 Highest Views) - Post (Sept 12):
11.4% ENG· 17.5K Reach · 417 Saves · 1.4K Likes · 29.3K Views - Reel (Aug 28):
12.8% ENG· 15.9K Reach · 250 Saves · 1.6K Likes · 200 Shares · 31.4K Views
Post Format Insight: While Reels consistently capture high impressions (up to 42.4K views), Static Carousel Posts generate the largest volume of saves (573 saves on a single post). Use Reels for broad discovery and static carousels for detailed styling and product specs.
4. Format Effectiveness, Stories & Audience Demographics
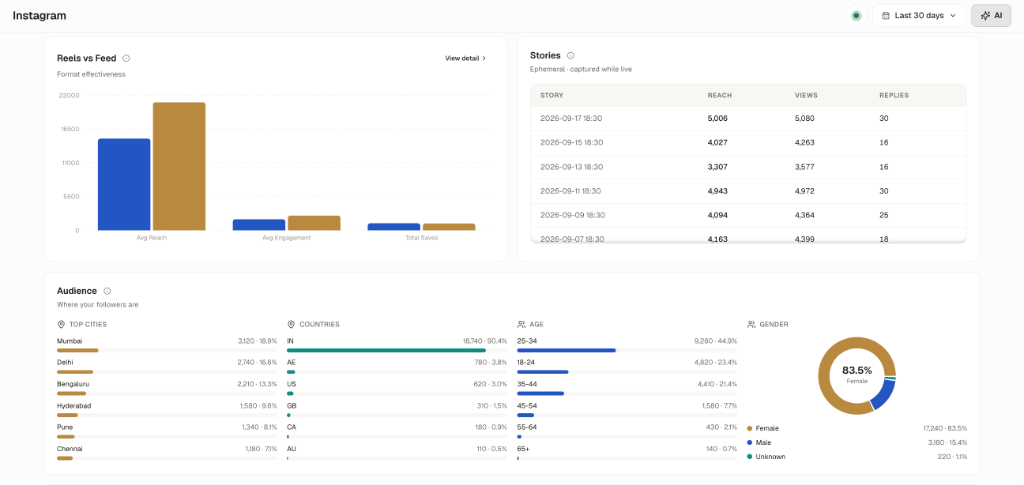
Reels vs. Feed effectiveness, live Story tracking, and geographic/demographic audience breakdown
A. Reels vs. Feed: Format Effectiveness
A direct comparative bar chart comparing Reels (brown bars) against Feed Posts (blue bars):- Average Reach: Reels average ~21,000 reach per asset vs. Feed posts at ~14,500 reach (Reels deliver ~45% more top-of-funnel reach).
- Average Engagement: Reels drive ~2,200 engagements vs. ~1,800 for Feed posts.
- Total Saves: Both formats tie closely (~450–500 saves), proving that well-photographed static imagery is equally effective at driving purchase intent.
B. Stories (Ephemeral · Captured While Live)
Instagram Stories expire after 24 hours in the native app, making long-term performance tracking difficult. Brandstack automatically records story analytics upon publication:
Takeaway: Your active stories reach a dedicated, high-intent core of 4,000 to 5,000 followers with direct reply rates reaching 30 DMs per story. This is your premier channel for exclusive discount drops and VIP pre-orders.
5. Audience Demographics: Geographic & Gender Truth
Understanding who follows your Instagram dictates your product design, pricing, and paid ad targeting:A. Top Cities
- Mumbai:
3,120followers (18.9%) - Delhi:
2,740followers (16.6%) - Bengaluru:
2,210followers (13.3%) - Hyderabad:
1,580followers (9.6%) - Pune:
1,340followers (8.1%) - Chennai:
1,180followers (7.1%)
B. International Reach & Countries
- 🇮🇳 India:
18,740(90.4%) - 🇦🇪 UAE:
780(3.8%) - 🇺🇸 United States:
620(3.0%) - 🇬🇧 United Kingdom:
310(1.5%) - 🇨🇦 Canada & Australia:
290followers
C. Age & Gender Distribution
- Gender: 83.5% Female (17,240 followers) vs. 15.4% Male (3,180 followers).
- Age Brackets:
- 25–34: 44.9% (9,260 followers) — The core affluent buying demographic.
- 18–24: 23.4% (4,820 followers) — College & early career trend-followers.
- 35–44: 21.4% (4,410 followers) — Premium luxury buyers.
- 45+: 9.8% (2,010 followers).
6. Facebook Page Integration Status

Facebook Page connection card: Connect your brand's Facebook page to aggregate cross-platform Meta social metrics
- Total organic Facebook Page likes and followers (e.g. 7,823 followers).
- Cross-posted reels and video watch times.
- Comments and sentiment from Facebook’s older demographic.
7. The Social Commerce Weekly Workflow
1
1. Review 30-Day Top Saves
Filter the Content Performance grid by
Reach and identify the top 3 posts with the most saves. Note the featured SKUs.2
2. Turn Top Organic Posts into Paid Ad Creatives
Take your top-performing organic reels (those with over 10% engagement and 20K+ reach) and whitelist them as Meta Ads. Organic winners almost always outperform studio-produced ads in paid feeds.
3
3. Maintain Story Cadence
Keep an active story schedule at peak engagement hours (e.g. 18:30) to consistently harvest 25–30 direct customer inquiries per story.
4
4. Align Inventory with Audience Cities
Ensure fast courier delivery coverage across Mumbai, Delhi, Bengaluru, and Hyderabad, which together house over 58% of your brand’s audience.